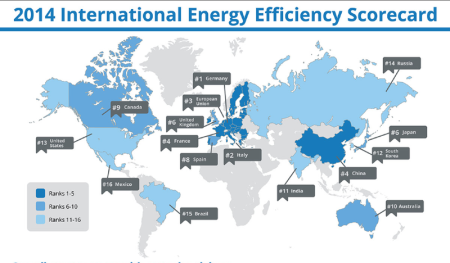
As Canadians scratch their heads trying to figure out how to diversify the economy, south of the 49th, a $20 billion industry is sprouting around energy conservation. With a 9th place standing on the International Energy Efficiency Score card and with fresh commitments made at COP21, Canadians have to hustle if we’re going to meet our targets.

In this 2014 international energy ranking, Canada was behind countries like China, Japan and most of Europe.
A new report put out by the Toronto Atmospheric Fund suggests that though Toronto’s GHG emissions went down 24% from 1990 baseline to 2013 (likely due to closures of large manufacturing plants and coal generation in Etobicoke) and surprise surprise, the bad news is that emissions actually rose 1.6% between 2012 and 2013. As TAF suggest “..bold new actions will be required to achieve the City’s climate targets.” So what’s it going to be Toronto?
Bloomberg News recently ran an article by James Nash titled “Fixing Drafty Old Buildings Becomes $20 Billion U.S. Industry” Nash says in his article, “A decade of progressively stricter laws aimed at reducing energy use and consumer desire to lower costs have already bred a $20 billion-a-year industry in the U.S., according to [Cliff Majersik, executive director of the Institute for Market Transformation]. Consultants guide property owners through the regulatory maze and help them file paperwork. Contractors retrofit old ventilation systems and fixtures, replace drafty windows, doors and roofs, and install state-of-the-art environmental controls.”
The article goes on to say “Most of the focus has been on new construction, but now people are really taking a look at existing buildings,” said Cliff Majersik, executive director of the Institute for Market Transformation, a Washington nonprofit that promotes more efficient buildings. “If you really want to move the needle on climate change, you can’t ignore the 99 percent of buildings that are already there.”
The article didn’t go into detail about what measures are typically mandated by Code Green, but it is likely based on regional priorities driven by climate. In the state of New York for example, buildings over 50,000 gross square feet have to comply to a list of energy performance demands. One of the key drivers in building efficiency is knowing how much energy your neighbours consume and to that end, Columbia University has created the map below.

Knowledge is key “This map will enable New York City building owners to see whether their own building consumes more or less than what an average building with similar function and size would,” said Vijay Modi, a professor of mechanical engineering, quoted in The New York Times Green blog.
Columbia University’s energy density map is amazingly detailed and interactive. The map represents an estimate of the total annual building energy consumption at the block level and at the tax lot level for New York City, and is expressed in kilowatt hours (kWh) per square meter of land area. A mathematical model based on statistics, not individual building data, was used to estimate the annual energy consumption values for buildings throughout the five boroughs. To see the percentage break down of the estimated end-uses, hover over or click on a block or tax lot. The tax lot level data shows how much energy an average building of that size and type would use.
Toronto’s 2030 District is looking to move the needle on the densely populated core of the city, but hard details on how remain to be seen and experience shows that both carrots (incentives) and sticks (legislation) work best to effect real change. That being said, The Globe and Mail states “…Ontario legislature is currently considering legislation, now in third reading, that will force building owners and developers to disclose the actual energy performance of their structures, as is now done in jurisdictions such as Boston, San Francisco and New York.”

